- Back to Home »
- The Top 1 percent in Indiana earn 17.3 times more than the bottom 99 percent of Hoosiers
Thursday, July 19, 2018
In The new
gilded age: Income inequality in the U.S. by state, metropolitan area, and
county, a new paper published by EPI for the Economic Analysis and
Research Network (EARN), Mark Price and Estelle Sommeiller detail the incomes
of the top 1 percent and the bottom 99 percent by state, metropolitan area, and
county.
“Rising inequality affects virtually every part of Indiana,
not just large urban areas or financial centers,” said Andrew Bradley, Senior
Policy Analyst for the Indiana Institute for Working Families, Indiana’s EARN
member organization. “It’s also a persistent problem throughout the country—in
big cities and small towns, in all 50 states. While the economy continues to
recover, federal and state policymakers should make it a top priority to grow
the incomes of working people while ensuring Indiana’s economy serves the lives
of all Hoosiers, not the narrow interests of corporate profits and the gilded
few."
Price and Sommeiller lay out the average incomes of the top
1 percent, the income required to be in the top 1 percent, and the gap between
the top 1 percent and the bottom 99 percent in every county and state as well
as in 916 metropolitan areas. The authors found that in 2015, the top 1 percent
took home 22.03 percent of all income across the U.S., while the top 1 percent took home 14.9 percent
of all income in Indiana.
A series of accompanying fact sheets detail income
inequality by state. Key findings include:
• The top 1 percent earned 17.3 times more than the bottom 99
percent in Indiana—making Indiana the 39th most unequal in the country.
• The average annual income of the top 1 percent in Indiana was $804,275.
To be in the top 1 percent in Indiana, one would have to earn $316,756.
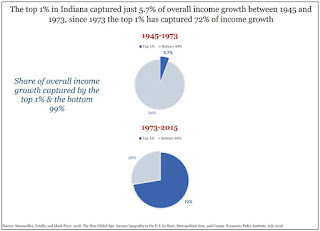
• Inequality grew sharply in the post-war years in Indiana. From
1945 to 1973, the top 1 percent captured 5.7 percent of overall income growth
in Indiana. But since 1973, the top 1 percent has captured 72.4 percent of
Indiana’s income growth.
• Inequality has grown more in Indiana than in the Midwest or
the United States over the past 45 years. From 1973 to 2015, the top 1 percent
have captured 72.4 percent of Indiana’s total income growth, compared to 71.5
percent for the Midwest and 65.4 percent for the U.S. That left the bottom 99
percent of Hoosiers with just 27.6 percent share of income growth, compared to
28.5 percent in the Midwest and 34.6 across the U.S.
• The most unequal metro area in Indiana is Warsaw, where the
top 1 percent makes an average of $1,353,969, 27.3 times more than the bottom
99%, who make an average of $49,675. The most unequal county in Indiana is Dubois
County, where the top 1 percent makes an average of $1,664,967, 30.2 times more
than the bottom 99%, who make an average of $55,196.


